Using Awstats to find issues with your website
cPanel includes the Awstats web statistics tool. Awstats uses your domain’s access logs to show detailed information about traffic to your website. The information is fairly self-explanatory, so I won’t bore you with a detailed overview of all the data shown by Awstats. Instead, I will focus on how you can use Awstats to identify potential issues with your website.
A little more about Awstats
There are quite a few tools that can show information about website traffic. The most popular choice is Google Analytics. Awstats is quite different from Google Analytics:
- Awstats is self-hosted. It uses Apache access logs to collate and display information about visits to your website. No data is sent to a third-party.
- Services like Google Analytics work by adding a bit of code to all pages on your website. The data is then collected and processed by the company providing the service.
- A downside of Awstats is that it needs to be installed and configured. However, you don’t have to worry about that on cPanel servers – the software is installed and enabled by default.
- Web analytics services usually provide more detailed information. However, the information is also less accurate as ad blockers and anti-tracking plugins block services like Google Analytics.
As said, there are lots of analytics solutions. Another common tool is Matomo (formally known as Piwik). Matomo is fairly similar to Google Analytics but no personal details are shared with an advertising company.
Understanding Awstats
Awstat’s interface isn’t the prettiest but it includes a wealth of information. The data is also fairly easy to understand. There are just a few things you need to know.
HTTP vs HTTPS traffic
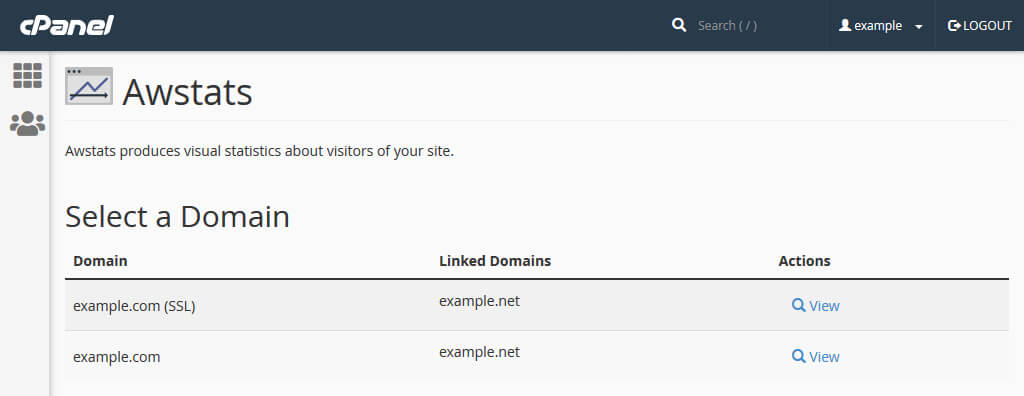
The main Awstats page (under Metrics » Awstats) lists all domains on your account, and each domain has its own View link. In the below screenshot there are two domains: example.com (SSL) and example.com. The first link shows data about HTTPS traffic and the latter is for HTTP traffic.

Image: a list with domain for which stats are available.
If your website has an SSL certificate and automatically redirects traffic from HTTP to HTTPS then you only need to check the SSL domain. This is one of the many reasons why you need to make sure you have a HTTPS redirect. If your website can still be accessed via HTTP and you are not sure how to fix that issue, please contact us and we can add a redirect for you.
Both domains shown in the above image have example.net as a “linked domain”. The linked domain is simply an alias. On this account I added the domain example.net as an alias, so that example.net shows the content of example.com. An alias doesn’t have its own Awstats data – the domain is lumped together with the main domain. Addon domains and subdomains do have their own statistics.
Human vs non-human traffic
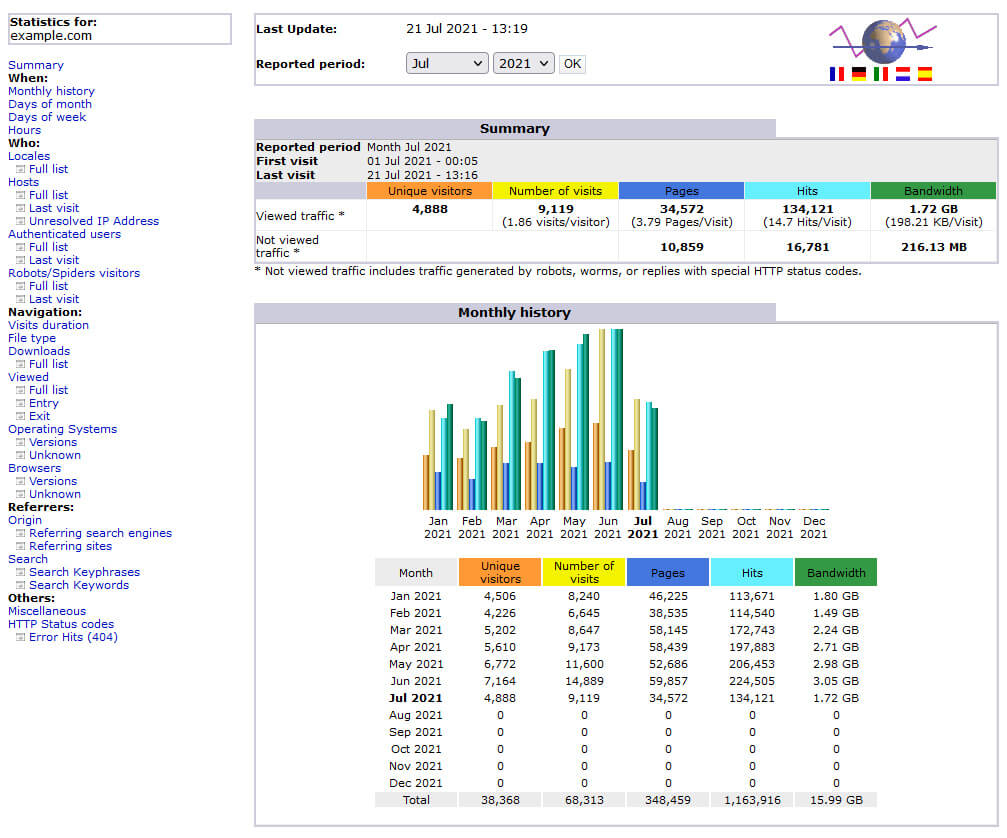
One of the first things you might notice when you look at the Awstats data is that it separates “viewed” and “not viewed” traffic. The latter category are mainly bots, such as the Googlebot and a plethora of SEO bots that crawl the internet nowadays. In other words, “not viewed traffic” are visits made by scripts rather than humans. This is not an exact science – the “viewed traffic” is bound to include a fair number of bots and scripts – but it does give you a better idea of the number of real visits your website gets.

Image: a summary of the traffic for example.com.
Most of the statistics shown on the page exclude “not viewed traffic”. For instance, the “Monthly History” and “Days of the Month” sections only show data for real visits. If you want more information about bots then you can check the “Robots/Spiders” section.
Hits and bandwidth
The terms “hit” and “bandwidth” can be a little confusing. A “hit” is a download. When someone visits a web page lots of resources may be downloaded: perhaps an HTML file, a couple of style sheets and some images. Each resource is a “hit”. In the image above you can see that there have been 134,121 hits so far this month, and that the average “hit rate” is 14.7 hits per visit.
The “bandwidth” is the combined size of all downloads. In the above example the average download size per visit is just under 200KB, which is fairly low. That is good, as less bandwidth means that pages can be downloaded and rendered faster.
Investigating bandwidth isssues
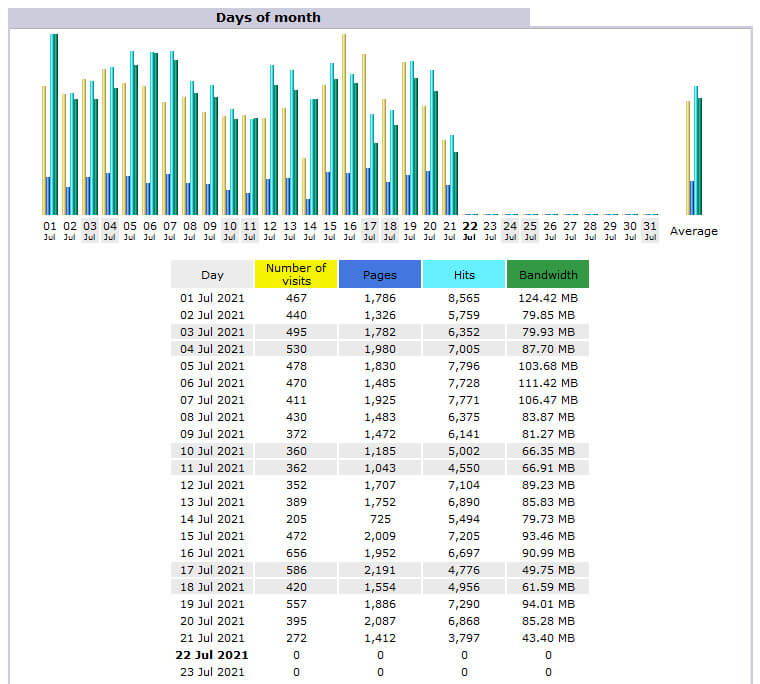
If the bandwidth for your website has suddenly spiked then there are a few things to look at. The first is the overall trend. The “Days of month” section shows the number of visits, pages viewed, hits and bandwidth for each day of the month. You can use this to check if the bandwidth usage has increased in line with an increase in the number of visitors. If so, you can next investigate the spike in visitor numbers. It might be that your website has simply become more popular (hurray!).

Image: a breakdown of the daily traffic.
If the bandwidth usage is disproportionate then the “File type” section may be useful. This shows a breakdown of all hits. So, you might find that a video you embedded on your home page has caused a spike in bandwidth usage.
Useless traffic
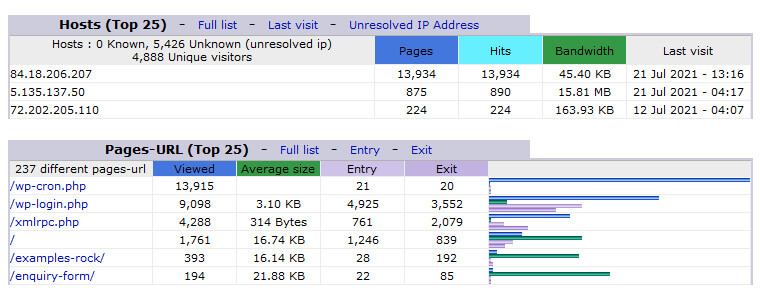
The “Hosts” and “Pages-URL” sections can also be useful. In the below example the server’s IP address (84.18.206.207) is responsible for the vast majority of hits. That typically indicates the server is running a script, and the top hit under “Pages-URL” confirms that is the issue indeed: there are a very large number of hits on wp-cron.php. The WordPress cron itself is useful but the default configuration is very poor; the cron is run on every page load. You can improve the performance of your WordPress website by replacing the WordPress cron with a real cron job.

Image: the top IP addresses and URLs.
The “Pages-URL” section reveals two other issues with the WordPress configuration: there are also a large number of hits on the wp-login.php and xmlrpc.php files:
- wp-login.php file is the default login page for the WordPress dashboard. This is a common target for attackers, and it therefore makes sense to change the login URL.
- xmlrpc.php is another common target for hackers. The file is mainly used for the WordPress “pingback” feature and to manage a WordPress install via apps like Jetpack. Unless you absolute need those features I strongly recommend disabling access to the xmlrpc.php file.
If you need any help with the above, please feel free to contact us.


