WordPress uses a handful of PHP constants that define how errors are handled. By default, PHP warnings, notices and errors are printed to different error_log files (and not displayed on your website). You can tweak the settings via Toolkit. For instance, you can change the settings so that all messages are displayed on your website and/or printed to a single log file.
An example error
When your website encounters a fatal PHP error you either get a completely blank screen or a page that is not fully rendered. The below image is an example of a page that is cut off. The header is shown correctly, but all the content is missing. So, something went wrong after the header was printed.
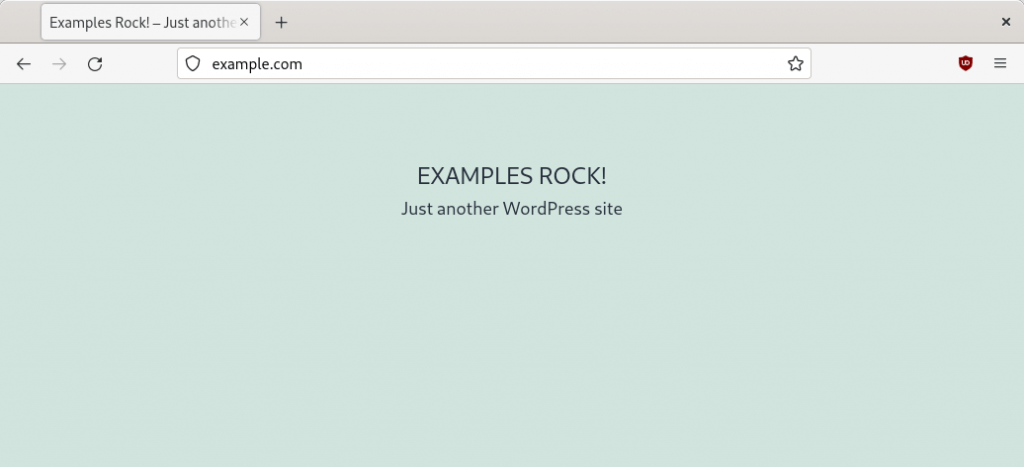
Image: My Examples Rock website. It is showing the header, but all the content is missing.
Log files
There are various settings that define how PHP messages are handled. By default, all PHP messages are printed to error_log files. The above error is showing in the log as follows:
$ cat /home/example/public_html/error_log
[29-Nov-2021 15:11:50 UTC] PHP Fatal error:  Uncaught Error: Call to undefined function foo() in /home/example/public_html/wp-content/themes/twentytwentyone/index.php:21
Stack trace:
#0 /home/example/public_html/wp-includes/template-loader.php(106): include()
#1 /home/example/public_html/wp-blog-header.php(19): require_once('/home/example/p...')
#2 /home/example/public_html/index.php(17): require('/home/example/p...')
#3 {main}
  thrown in /home/example/public_html/wp-content/themes/twentytwentyone/index.php on line 21
The error message points to an undefined PHP function on line 21 of the theme’s index.php file. I will look at the file shortly, but let’s first look at the WordPress debugging options.
WordPress debugging options
The same error can be printed on your website. You typically want to avoid that. Anyone visiting your website would see the error message. That looks ugly, and it reveals sensitive information about your website. However, it is fine to enable debugging on a (private) development copy of your website.
It is worth noting that PHP message are still printed to error_log files when you enable debugging. So, effectively PHP messages are printed twice. The main benefit of enabling debugging is that you instantly see which pages are triggering errors. You don’t have to keep an eye on error_log files. That is particularly useful on cPanel servers, as errors are typically printed to an error_log file in the directory that triggered the error. The error_log file in the public_html folder might look fine, but there might be a huge error_log file in, say, the directory for a plugin.
You can enable debugging from the Dashboard tab in Toolkit. After you toggle the Debugging setting you can next click on the settings icon to tweak the debugging settings.
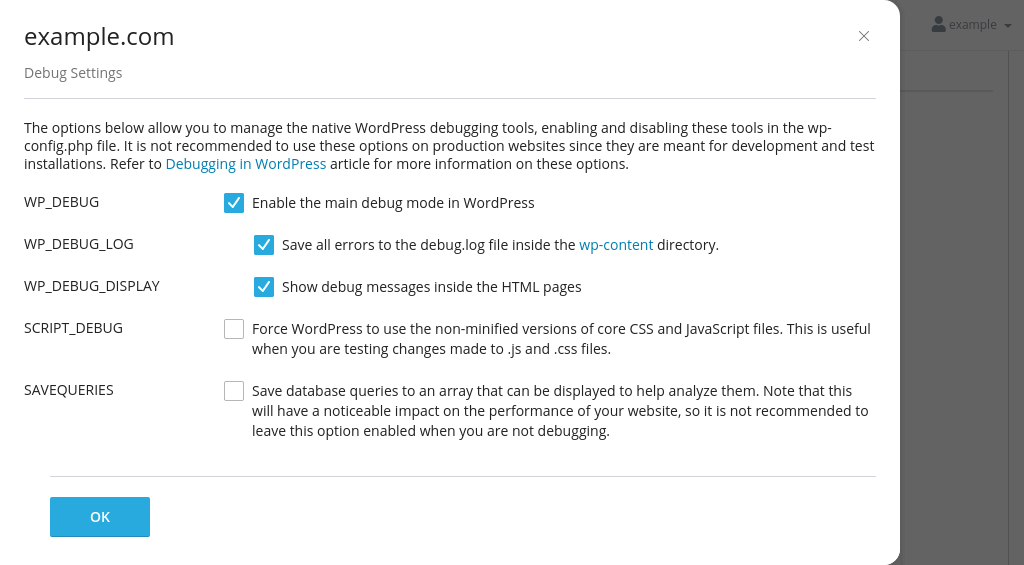
Image: the debug settings in Toolkit.
Logging and/or displaying
When you enable debugging Toolkit updates the debugging constants in your website’s wp-config.php file. By default there is just one contant: WP_DEBUG. On a fresh WordPress install this is set to false, which means that debugging is disabled. When you change the value to true errors are printed on the website.
There are two constants that define where error messages are displayed:
- WP_DEBUG_DISPLAY defines whether or not PHP messages should be shown on the website. The value can be true or false. The default value is true. So, if you simply set WP_DEBUG to true all PHP errors are printed on your website.
- WP_DEBUG_LOG defines whether or not PHP message should be written to a log. The value can be true, false or the path to a file. Toolkit uses the file /wp-content/debug.log when you set the variable to true.
In the above image I enabled both WP_DEBUG_LOG and WP_DEBUG_DISPLAY. That means that any PHP messages are both printed on the website and stored in a log. My website now looks like this:

Image: the same PHP error, now printed on the screen.
Of course, you don’t want to show PHP messages on a production website. If you ever need to enable debugging on a live website then it is best to set WP_DEBUG_DISPLAY to false and WP_DEBUG_LOG to true. That way you can easily see any errors in the debug.log file, but no errors are displayed on your website.
Fixing errors
As already mentioned, the error is on line 21 of the theme’s index.php file. In this case, the script calls the function foo(). That triggers a fatal error, because the function doesn’t exist.
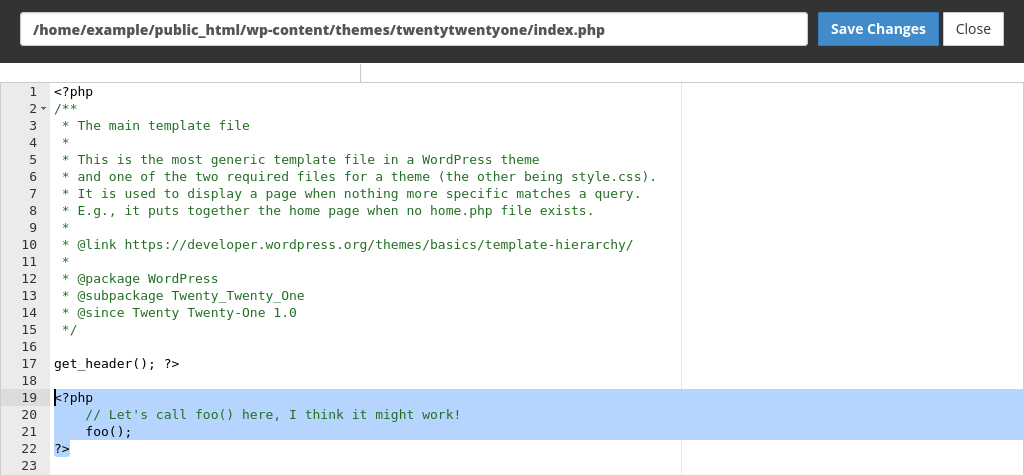
Image: calling foo doesn’t work here.
Often, PHP errors are not as obvious as this example. And, errors are not always related to PHP either. A completely blank screen is often caused by a fatal PHP error, but there are other potential causes. For instance, it may be that there is an error in an Apache configuration file (such as an .htaccess file) or that your website’s file permissions are in a muddle. If you don’t see any errors after you have enabled debugging then the issue is likely to be something else entirely.
Debugging the Apache configuration and file permission issues can be tricky, as those errors are logged to Apache’s global error log. cPanel users don’t have access to that log, so unless you are a server administrator it is near-impossible to debug the error. Please contact us if you want us to check if there are any such errors.
Script debugging and database queries
There are two other debugging options you can enable via Toolkit. The first is SCRIPT_DEBUG. This option uses non-minified versions of CSS and JavaScript files where possible. It is a nice option to have, but it is only really useful if you are making changes to core CSS and JavaScript files.
SAVEQUERIES is more interesting. The option is a bit like a poor man’s version of the slow query log in MariaDB/MySQL. It stores all database queries that are executed in an array ($wpdb->queries), which can be called from a PHP script.
For instance, after you have set SAVEQUERIES to true you can add this code at the top of your template’s index.php file:
if (current_user_can('administrator')){
    global $wpdb;
    echo "</pre>";
    print_r($wpdb->queries);
    echo "</pre>";
}
The first line makes sure that queries are only printed if we are logged in as a user with admin privileges. It then dumps the queries inside a <pre> element. If you refresh the page you get a long list with database queries that were run. For the home page of my Examples Rock website the array contained no less than 16 items.
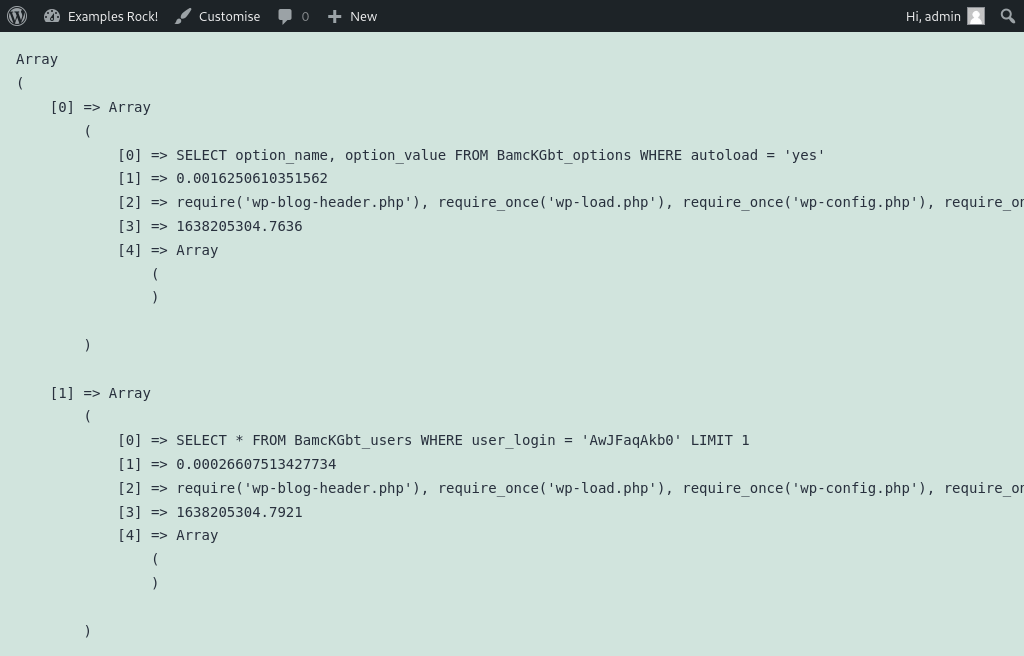
Image: viewing SQL queries.
Each array element contains different bits of information. The first element is the query that was run and the second line shows how long it took for the query to run. The third element is the function that triggered the query, and the final field is the the Unix timestamp (the current time as the number of seconds since the start of 1 January 1970).
The main thing to look for are very large queries that take a long time to execute.